
When people debate energy choices, carbon footprints usually dominate the conversation. Coal earns its reputation as the dirtiest fuel, with roughly 900 grams of CO₂ released per kilowatt-hour produced. Wind, solar, and nuclear sit near the bottom of the carbon scale, their emissions tied mainly to construction, mining, and materials. Externalities such as CO₂ emissions, landscape disruption, and ecosystem impacts have been studied and quantified for decades (Bickel & Friedrich, 2005). Yet one of the most consequential metrics remains largely overlooked: how many people die from producing the power we consume?
This lesser-known measure—the deathprint—captures both direct fatalities and broader health consequences associated with each energy source. Drawing on epidemiological studies, national health assessments, and global disease burden analyses (Cohen et al., 2005; NAS, 2010; Pope et al., 2002; WHO 2007), a clear pattern emerges: fossil fuels are staggeringly lethal, renewable sources are relatively safe, and nuclear power—contrary to public fear—sits at the very bottom of the list.
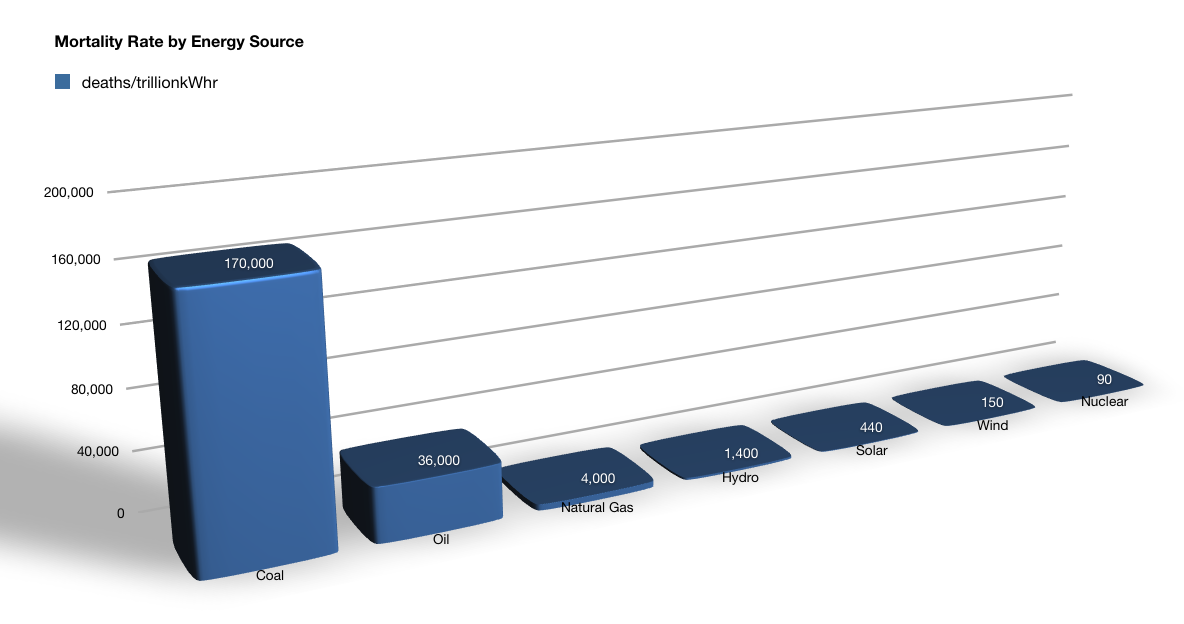
| Energy Source | Mortality Rate (deaths/trillion kWhr) | Share of Electricity/Energy |
|---|---|---|
| Coal – global average | 170,000 | 50% global electricity |
| Coal – China | 280,000 | 75% China’s electricity |
| Coal – U.S. | 15,000 | 44% U.S. electricity |
| Oil | 36,000 | 36% of energy, 8% of electricity |
| Natural Gas | 4,000 | 20% global electricity |
| Biofuel/Biomass | 24,000 | 21% global energy |
| Solar (rooftop) | 440 | < 1% global electricity |
| Wind | 150 | ~ 1% global electricity |
| Hydro – global average | 1,400 | 15% global electricity |
| Nuclear – global average | 90 | 17% global electricity w/ Chernobyl & Fukushima |
The Human Cost of Fossil Fuels
Coal
Coal’s toll is unmatched. Fine particulate emissions from combustion penetrate deep into the lungs, driving cardiopulmonary disease, cancer, and widespread respiratory distress. Long-term exposure raises mortality rates dramatically, as documented in large studies linking PM2.5 pollution to early death (Pope et al., 2002).
Globally, coal causes roughly 100,000 deaths per trillion kWh. But where pollution controls are weak, the cost skyrockets. China’s rapid coal build-out—with limited exhaust-scrubbing—pushes mortality rates to about 170,000 deaths per trillion kWh, contributing to hundreds of thousands of premature deaths annually.
Contrast this with the United States, where decades of regulation—particularly the Clean Air Act—have slashed coal’s deathprint to around 10,000 deaths per trillion kWh. The legislation’s effectiveness is well-documented (Scott et al., 2005), making it one of the most life-saving public health achievements in modern history.
Oil
Oil combustion, though cleaner than coal, still accounts for massive global mortality due to particulate pollution and toxic emissions. At an estimated 36,000 deaths per trillion kWh, oil’s health burden remains substantial, especially in regions with dense traffic or heavy reliance on oil-fired generation.
Natural Gas
Often portrayed as a “bridge fuel,” natural gas has a lower—but still significant—deathprint. Leakage, combustion pollution, and production accidents contribute to roughly 4,000 deaths per trillion kWh worldwide. While cleaner than coal or oil, its health impacts remain far from negligible.
Biofuel and Biomass: The Silent global killer
Despite being framed as carbon-neutral, biomass combustion produces heavy particulate loads. Indoors, especially in developing countries, these emissions become deadly. The World Health Organization has repeatedly flagged household biomass burning as a major global health threat (WHO 2007).
Worldwide, the deathprint of biofuels and biomass is about 24,000 deaths per trillion kWh, comparable to oil—far higher than most people assume for a “renewable” fuel.
Renewables: Not Perfect, but Far Safer
Solar (Rooftop)
At roughly 440 deaths per trillion kWh, solar’s impacts are dominated by installation and maintenance accidents. As deployment grows, industry safety standards have improved, steadily reducing these numbers.
Wind
With an estimated 150 deaths per trillion kWh, wind stands among the safest large-scale energy technologies. Most fatalities involve falls during turbine construction or maintenance—rare but still present. Compared to fossil fuels, however, wind’s footprint is extraordinarily small.
Hydropower: Safe—Except When It Isn’t
Most hydropower facilities operate with extremely low mortality rates. In the United States, hydropower causes roughly 5 deaths per trillion kWh, thanks to stringent dam safety regulations enforced by the Federal Energy Regulatory Commission.
Globally, however, catastrophic failures skew the statistics. The 1976 Banqiao Dam disaster alone killed roughly 171,000 people. When averaged across total global production, hydropower registers about 1,400 deaths per trillion kWh, making it safer than fossil fuels but riskier than wind or nuclear.
Nuclear: The Lowest Deathprint of All
Including the worst-case estimates from Chernobyl and Fukushima, and applying conservative radiation models such as the Linear No-Threshold hypothesis, nuclear power’s global deathprint remains only 90 deaths per trillion kWh. In the United States, the figure drops to 0.1, reflecting stringent regulatory oversight by the Nuclear Regulatory Commission and strong safety cultures at U.S. plants.
Most nuclear-associated fatalities stem not from power plants but the weapons complex in earlier decades. Modern civilian reactors, particularly post-Gen-III designs with passive safety features, demonstrate extraordinarily low risk.
Moreover, nuclear generation is so energy-dense that the number of facilities—and thus the number of potential accident sites—is tiny compared to other energy technologies.
A Hidden Health Care Price Tag
The mortality impacts of fossil fuels come with enormous medical costs. Studies estimate that health-related externalities raise national health expenditures by roughly 10% in regions heavily dependent on coal and other combusted fuels (NAS, 2010; Cohen et al., 2005). In the U.S., where annual health care spending exceeds $2.6 trillion, these external costs approach half the nation’s total electricity bill.
The disparity between cities illustrates the burden:
• Beijing requires roughly 2,000 lives per year to power the city’s grid mix (largely coal-based).
• New York, with a much cleaner mix, incurs approximately 200 deaths per year in comparison.
The difference is regulation, technology, and fuel choice—not inevitability.
The True Cost of a Kilowatt
When ranked by deathprint, the hierarchy is unmistakable:
1. Coal – worst by a wide margin
2. Oil and Biomass – major global health burdens
3. Natural Gas – significant but lower
4. Hydropower – usually safe, except rare disasters
5. Solar and Wind – very low mortality
6. Nuclear – lowest of all
The data show that energy decisions are not just environmental—they are profoundly medical. Every kilowatt-hour carries a human consequence, and some fuels require thousands of lives to sustain.
Understanding this reality doesn’t only inform policy; it reshapes the ethics of the energy choices we make.
In the end, the deadliest kilowatt is the one we choose not to question.